Tutorial: Node Query
In the Node search bar in Home, select the context of the networks you would like to query. There are for options: "Tissues", "Cell Lines", "Cell Types" and "Species". Once selected, type the name of your gene of interest in the search bar.
A dropdown of available genes in that context will appear. Select one and click "Submit".
Once the result page has finished loading, a table of networks in with your gene of interest will be shown:
| Network | Description | tissues |
|---|---|---|
| 0000029 | DiGraph with 11001 nodes and 150555 edges | lymph node |
| 0000992 | DiGraph with 17899 nodes and 2034851 edges | ovary |
| 0000945 | DiGraph with 18618 nodes and 2034851 edges | stomach |
| 0000317 | DiGraph with 9457 nodes and 2034851 edges | colonic mucosa |
| 0000310 | DiGraph with 16306 nodes and 2034851 edges | breast |
| 0000002 | DiGraph with 4768 nodes and 11369 edges | uterine cervix |
| 0000955 | DiGraph with 10566 nodes and 2034851 edges | brain |
| 0000173 | DiGraph with 10438 nodes and 105578 edges | amniotic fluid |
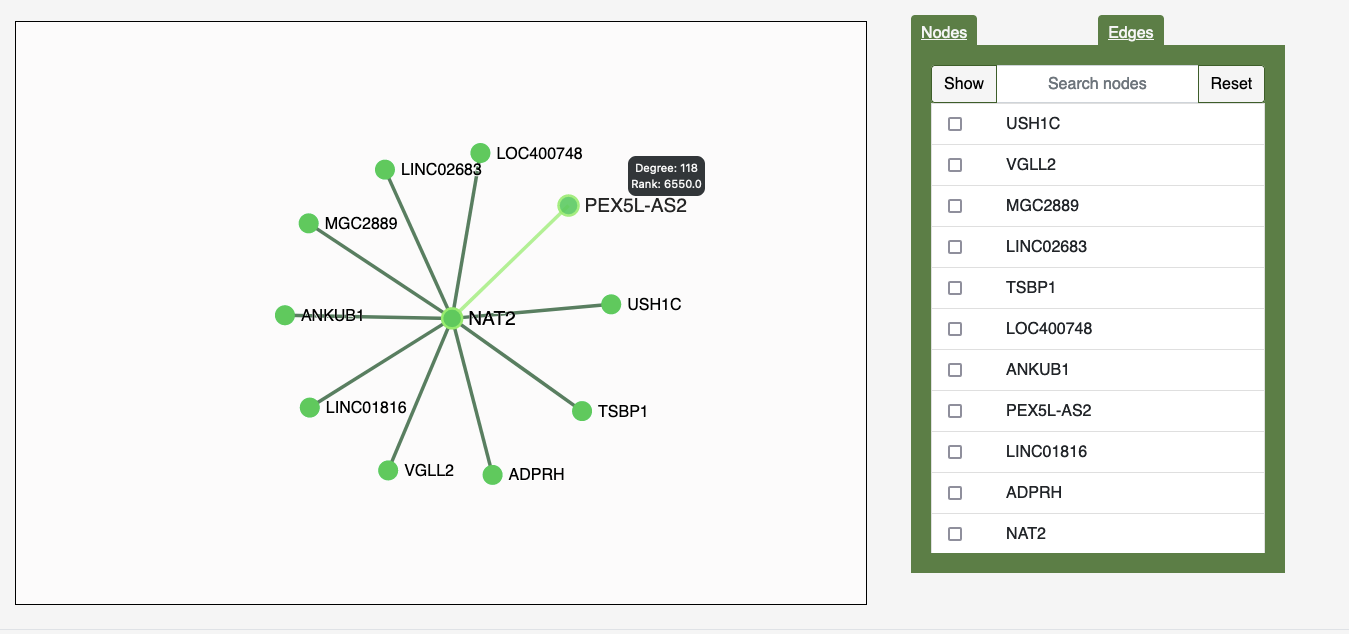
You can click on a network to see the graph.

In the graph interface, you can use the Nodes Tab to select which nodes you'd like to see, and the Edges Tag to change the width of the network's edges. In the graph itself, you can hover over a particular node to see the node's degree and degree rank.
Tutorial: Network Query
In the Network search bar in Home, type the name or ID of the network you would like to explore and click "Submit".
A results table appear, showing the nodes and node properties of your network. You can sort the columns of by clicking on the column headers. You can click on a node, to query it in the current context.
| Node | Degree | Degree Rank | Housekeeping |
|---|---|---|---|
| NAT2 | 507 | 2604.5 | False |
| FAM229A | 73 | 8783.0 | False |
| STAU2-AS1 | 1123 | 749.0 | False |
| C20orf78 | 597 | 2113.5 | False |
| GTF3C2 | 999 | 975.0 | True |
| AGTRAP | 999 | 975.0 | False |
| BCDIN3D-AS1 | 999 | 975.0 | False |
| KPNA2 | 997 | 977.5 | >False |
| PSTPIP2 | 997 | 977.5 | False |
| BATF2 | 996 | 977.5 | False |
Tutorial: Pathway Similarities
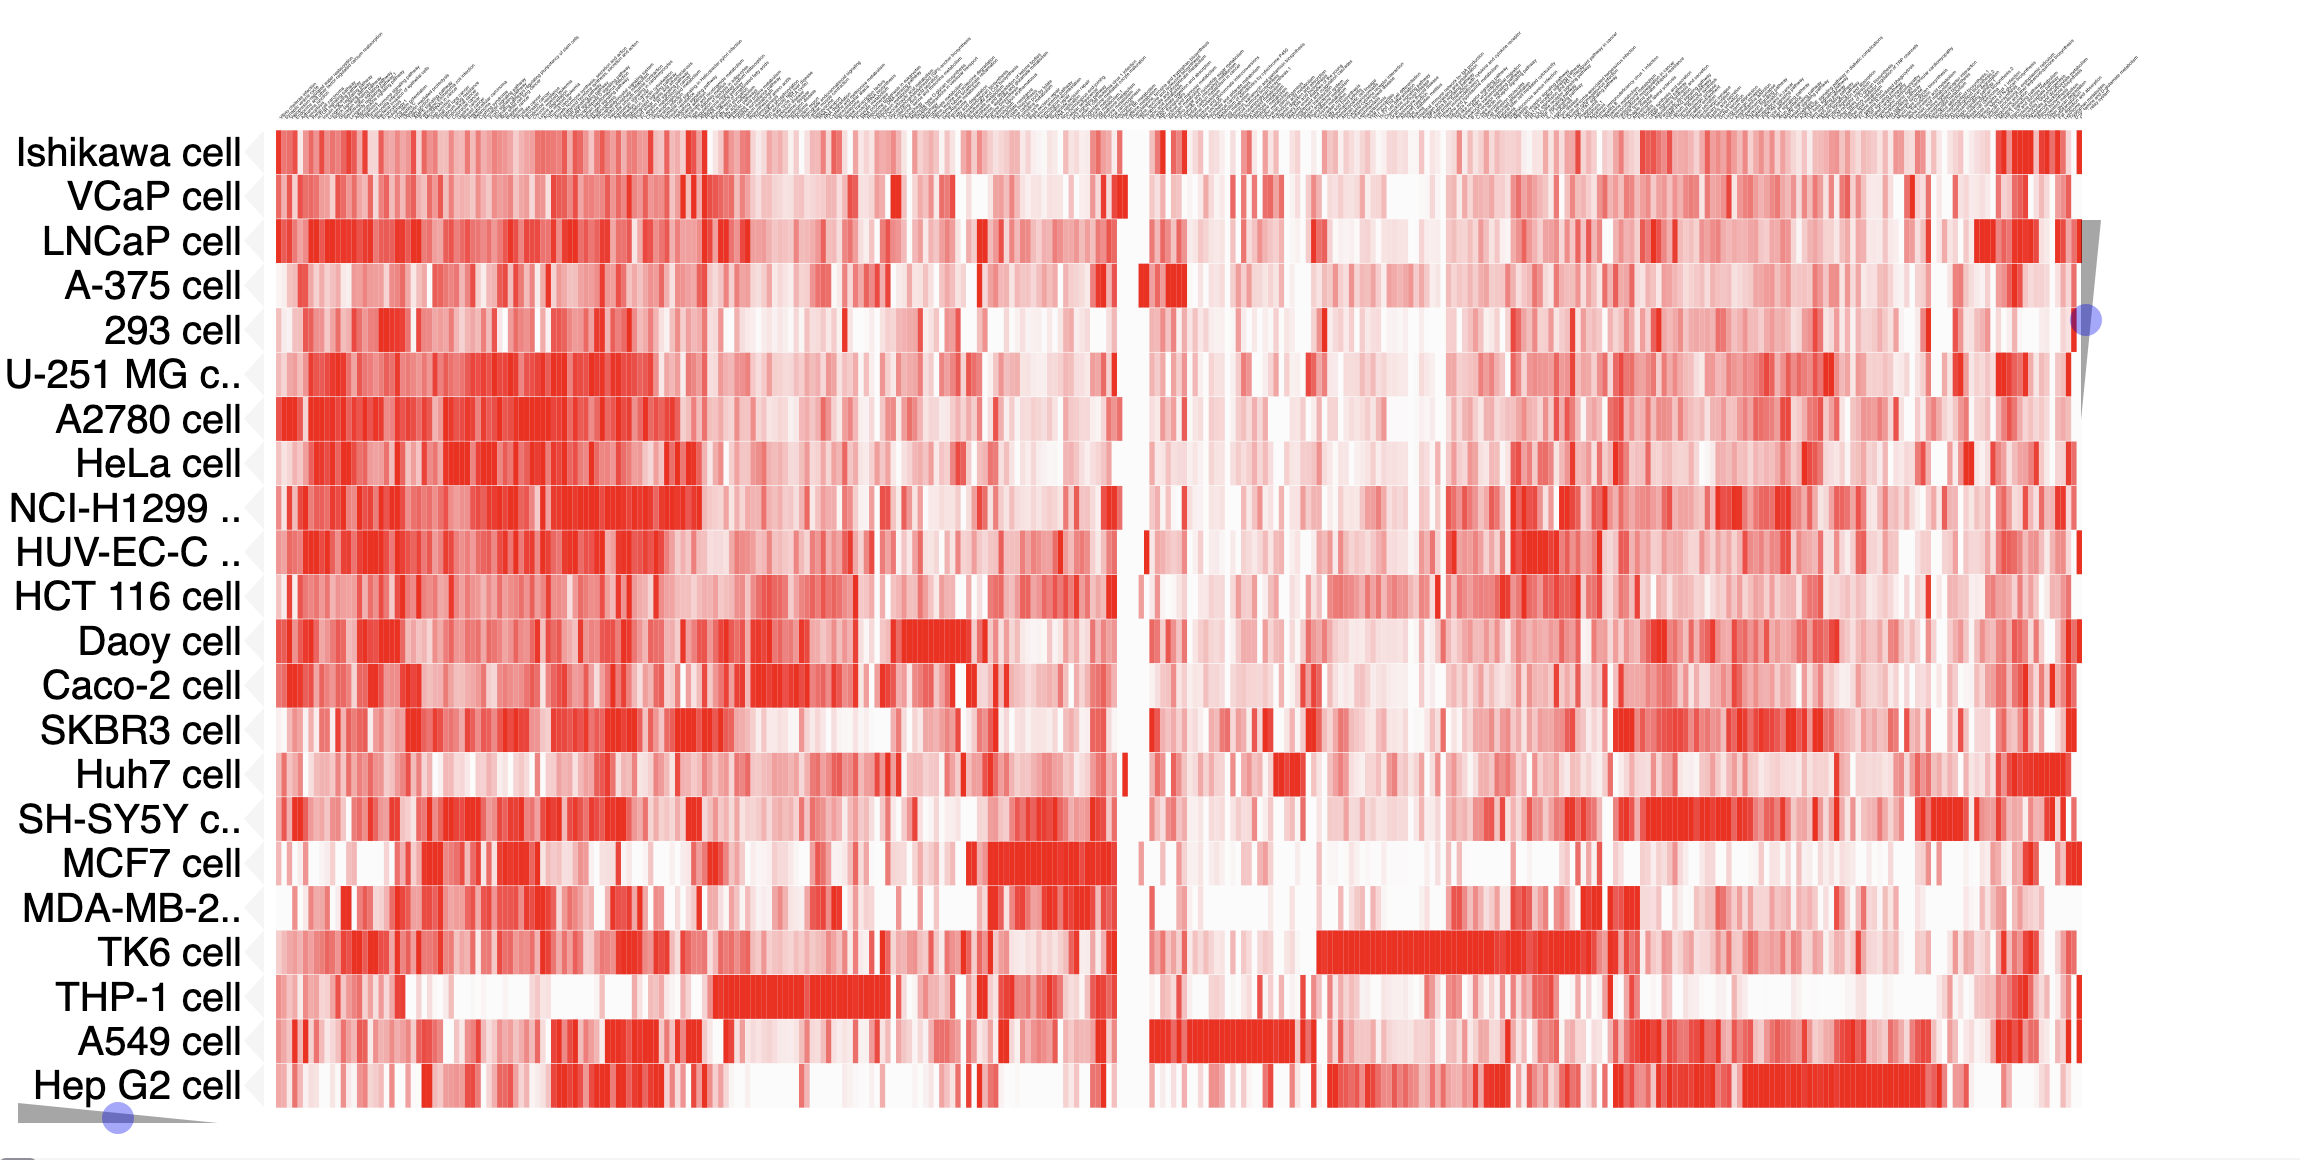
You can also explore a the network overlap of particular context (Tissue, Cell Line, Cell Type), in the Clustergrams available in the "Pathway Similarity" menu on the navigation bar.
